SRS Log System


Note: 如果觉得Github的Wiki访问太慢,可以访问 Gitee 镜像。
SRS支持打印到console和file,支持设置level,支持连接级别的日志,支持可追溯日志。
LogTank
LogTank即log的容器,日志打印到什么地方。
SRS提供两种打印日志的方式,通过配置srs_log_tank:
- console:打印日志到控制台。当配置文件没有加载时,也打印到控制台。
- file: 默认,打印日志到文件。必须指定配置
srs_log_file,日志文件。日志文件默认为:./objs/srs.log
配置文件中的说明:
# the log tank, console or file.
# if console, print log to console.
# if file, write log to file. requires srs_log_file if log to file.
# default: file.
srs_log_tank        file;
LogLevel
LogLevel就是log的级别,什么级别的日志才会打印出来。
SRS支持设置日志级别,通过设置srs_log_level:
- verbose: 非常详细的日志,性能会很低,日志会非常多。SRS默认是编译时禁用这些日志,提高性能。
- info:较为详细的日志,性能也受影响。SRS默认编译时禁用这些日志。
- trace: 重要的日志,比较少,SRS默认使用这个级别。
- warn: 警告日志,SRS在控制台以黄色显示。若SRS运行较稳定,可以只打开这个日志。建议使用trace级别。
- error: 错误日志,SRS在控制台以红色显示。
配置文件中的说明:
# the log level, for all log tanks.
# can be: verbose, info, trace, warn, error
# default: trace
srs_log_level       trace;
注意事项:
- 设置了低级别的日志,自动会打印高级别的。譬如设置为trace,那么trace/warn/error日志都会打印出来。
- 默认verbose和info是编译时禁用的,若需要打开这两个日志,需要修改
srs_kernel_log.hpp,将对应的禁用编译宏打开。 - 推荐使用trace级别,重要的日志不多,对于排错很方便。如果有错误,建议用gdb调试,不要依赖日志。只有在不得已时才用日志排错。
工具的日志
Transcode/Ingest等都是用到了外部工具,譬如FFMPEG,所以我们统称ffmpeg日志。
SRS可以配置ffmpeg的日志路径,若配置为/dev/null则禁用ffmpeg日志,在某些嵌入式系统磁盘较小时比较有用,需要减少日志时有用:
# the logs dir.
# if enabled ffmpeg, each stracoding stream will create a log file.
# "/dev/null" to disable the log.
# default: ./objs
ff_log_dir          ./objs;
日志格式
SRS的日志可以定位到某个连接,可以在混杂了成千上万个连接的日志中找到某一个连接的日志,譬如要看某个客户端的日志。这个功能和SRS的日志格式设计相关,譬如:
[2014-04-04 11:21:29.183][trace][2837][104][11] rtmp get peer ip success. ip=192.168.1.179
日志格式如下:
- [2014-04-04 11:21:29.183] 日志的日期,毫秒数因为SRS的时间cache,分辨率定义在SRS_TIME_RESOLUTION_MS,即500毫秒更新一次时间。防止gettimeofday函数调用造成性能问题。
- [trace] 日志的级别,参考上面对日志级别的定义。打印到控制台的日志,trace是白色,warn是黄色,error是红色。一般只有trace日志说明没有发现异常。
- [2837] 进程pid(SrsPid)。进程之间的session id可能有重复。
- [104] 会话ID,即SessionId(SrsId)。进程存活期间,保证id唯一,从0开始计算。这个就是找到某个连接的日志的关键。
- [11] errno,系统错误码。这个在error时才有效,其他时候这个值没有意义。
- rtmp get peer ip success. 日志的文本。若有错误,一般会打印出错误码,譬如:identify client failed. ret=211(Timer expired) 说明是超时。
下面是一些常用的日志分析方法。
Tracable Log
某个客户端如果出现问题,譬如投诉说卡,播放断开,如何排查问题?SRS提供基于连接的日志,可以根据连接的id查询这个客户端在服务器的日志(参考下面基于连接的日志)。
如果服务器是多层结构呢?譬如CDN集群,有时候就需要查询连接的回源连接,以及回源连接在上层服务器的日志。这个时候快速知道客户端或者边缘在上层服务器的ID就及其重要了。
客户端或者边缘能拿到自己在上层服务器的ID,就是可追溯日志。我举个例子:
播放流:rtmp://dev:1935/live/livestream
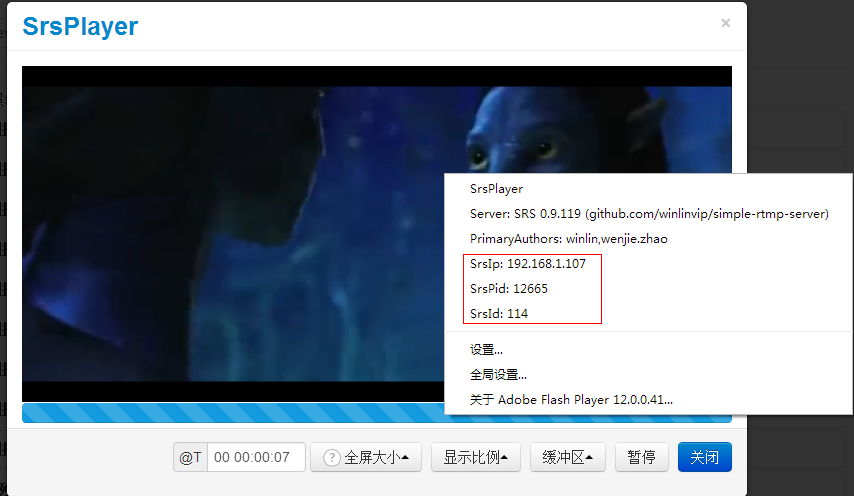 能看到SrsIp,即服务器ip为192.168.1.107,对于DNS解析而言,这个很重要,知道是哪个边缘节点。SrsPid为9131,SrsId为117,所以去这个服务器上grep关键字"[9131][117]"就可以。
[winlin@dev6 srs]$ grep -ina "\[12665\]\[114\]" objs/edge.log
1307:[2014-05-27 19:21:27.276][trace][12665][114] serve client, peer ip=192.168.1.113
1308:[2014-05-27 19:21:27.284][trace][12665][114] complex handshake with client success
1309:[2014-05-27 19:21:27.284][trace][12665][114] rtmp connect app success. tcUrl=rtmp://dev:1935/live, pageUrl=http://ossrs.net/players/srs_player.html?vhost=dev&stream=livestream&server=dev&port=1935, swfUrl=http://ossrs.net/players/srs_player/release/srs_player.swf?_version=1.21, schema=rtmp, vhost=__defaultVhost__, port=1935, app=live
1310:[2014-05-27 19:21:27.486][trace][12665][114] set ack window size to 2500000
1311:[2014-05-27 19:21:27.486][trace][12665][114] identify ignore messages except AMF0/AMF3 command message. type=0x5
1312:[2014-05-27 19:21:27.501][trace][12665][114] ignored. set buffer length to 800
1313:[2014-05-27 19:21:27.501][trace][12665][114] identify ignore messages except AMF0/AMF3 command message. type=0x4
1314:[2014-05-27 19:21:27.518][trace][12665][114] identity client type=play, stream_name=livestream, duration=-1.00
1315:[2014-05-27 19:21:27.518][trace][12665][114] identify client success. type=Play, stream_name=livestream, duration=-1.00
1316:[2014-05-27 19:21:27.518][trace][12665][114] set output chunk size to 4096
1317:[2014-05-27 19:21:27.518][trace][12665][114] source url=__defaultVhost__/live/livestream, ip=192.168.1.113, cache=1, is_edge=1, id=-1
1318:[2014-05-27 19:21:27.518][trace][12665][114] dispatch cached gop success. count=0, duration=0
1319:[2014-05-27 19:21:27.518][trace][12665][114] create consumer, queue_size=30.00, tba=0, tbv=0
1322:[2014-05-27 19:21:27.518][trace][12665][114] ignored. set buffer length to 800
1333:[2014-05-27 19:21:27.718][trace][12665][114] update source_id=115
1334:[2014-05-27 19:21:27.922][trace][12665][114] -> PLA time=301, msgs=12, okbps=1072,0,0, ikbps=48,0,0
会发现回源连接的id为115(source_id=115),所以查找这个链接:
[winlin@dev6 srs]$ grep -ina "\[12665\]\[115\]" objs/edge.log
1320:[2014-05-27 19:21:27.518][trace][12665][115] edge connected, can_publish=1, url=rtmp://dev:1935/live/livestream, server=127.0.0.1:19350
1321:[2014-05-27 19:21:27.518][trace][12665][115] connect to server success. server=127.0.0.1, ip=127.0.0.1, port=19350
1323:[2014-05-27 19:21:27.519][trace][12665][115] complex handshake with server success.
1324:[2014-05-27 19:21:27.561][trace][12665][115] set ack window size to 2500000
1325:[2014-05-27 19:21:27.602][trace][12665][115] drop unknown message, type=6
1326:[2014-05-27 19:21:27.602][trace][12665][115] connected, version=0.9.119, ip=127.0.0.1, pid=12633, id=141
1327:[2014-05-27 19:21:27.602][trace][12665][115] set output chunk size to 60000
1328:[2014-05-27 19:21:27.602][trace][12665][115] edge change from 100 to state 101 (ingest connected).
1329:[2014-05-27 19:21:27.603][trace][12665][115] set input chunk size to 60000
1330:[2014-05-27 19:21:27.603][trace][12665][115] dispatch metadata success.
1331:[2014-05-27 19:21:27.603][trace][12665][115] update video sequence header success. size=46
1332:[2014-05-27 19:21:27.603][trace][12665][115] update audio sequence header success. size=4
1335:[2014-05-27 19:21:37.653][trace][12665][115] <- EIG time=10163, okbps=0,0,0, ikbps=234,254,231
发现回源链接在服务器上的标识为:connected, version=0.9.119, ip=127.0.0.1, pid=12633, id=141,去上层服务器查找日志:
[winlin@dev6 srs]$ grep -ina "\[12633\]\[141\]" objs/srs.log
783:[2014-05-27 19:21:27.518][trace][12633][141] serve client, peer ip=127.0.0.1
784:[2014-05-27 19:21:27.519][trace][12633][141] complex handshake with client success
785:[2014-05-27 19:21:27.561][trace][12633][141] rtmp connect app success. tcUrl=rtmp://dev:1935/live, pageUrl=, swfUrl=, schema=rtmp, vhost=__defaultVhost__, port=1935, app=live
786:[2014-05-27 19:21:27.561][trace][12633][141] set ack window size to 2500000
787:[2014-05-27 19:21:27.561][trace][12633][141] identify ignore messages except AMF0/AMF3 command message. type=0x5
788:[2014-05-27 19:21:27.602][trace][12633][141] identity client type=play, stream_name=livestream, duration=-1.00
789:[2014-05-27 19:21:27.602][trace][12633][141] identify client success. type=Play, stream_name=livestream, duration=-1.00
790:[2014-05-27 19:21:27.602][trace][12633][141] set output chunk size to 60000
791:[2014-05-27 19:21:27.602][trace][12633][141] source url=__defaultVhost__/live/livestream, ip=127.0.0.1, cache=1, is_edge=0, id=131
792:[2014-05-27 19:21:27.602][trace][12633][141] dispatch cached gop success. count=241, duration=3638
793:[2014-05-27 19:21:27.602][trace][12633][141] create consumer, queue_size=30.00, tba=44100, tbv=1000
794:[2014-05-27 19:21:27.602][trace][12633][141] ignored. set buffer length to 65564526
795:[2014-05-27 19:21:27.604][trace][12633][141] set input chunk size to 60000
798:[2014-05-27 19:21:32.420][trace][12633][141] -> PLA time=4809, msgs=14, okbps=307,0,0, ikbps=5,0,0
848:[2014-05-27 19:22:54.414][trace][12633][141] -> PLA time=86703, msgs=12, okbps=262,262,0, ikbps=0,0,0
867:[2014-05-27 19:22:57.225][trace][12633][141] update source_id=149
同样发现这个源头是149(source_id=149),即编码器推流上来的id。
[winlin@dev6 srs]$ grep -ina "\[12633\]\[149\]" objs/srs.log
857:[2014-05-27 19:22:56.919][trace][12633][149] serve client, peer ip=127.0.0.1
858:[2014-05-27 19:22:56.921][trace][12633][149] complex handshake with client success
859:[2014-05-27 19:22:56.960][trace][12633][149] rtmp connect app success. tcUrl=rtmp://127.0.0.1:19350/live?vhost=__defaultVhost__, pageUrl=, swfUrl=, schema=rtmp, vhost=__defaultVhost__, port=19350, app=live
860:[2014-05-27 19:22:57.040][trace][12633][149] identify client success. type=publish(FMLEPublish), stream_name=livestream, duration=-1.00
861:[2014-05-27 19:22:57.040][trace][12633][149] set output chunk size to 60000
862:[2014-05-27 19:22:57.040][trace][12633][149] source url=__defaultVhost__/live/livestream, ip=127.0.0.1, cache=1, is_edge=0, id=-1
863:[2014-05-27 19:22:57.123][trace][12633][149] set input chunk size to 60000
864:[2014-05-27 19:22:57.210][trace][12633][149] dispatch metadata success.
865:[2014-05-27 19:22:57.210][trace][12633][149] update video sequence header success. size=46
866:[2014-05-27 19:22:57.210][trace][12633][149] update audio sequence header success. size=4
870:[2014-05-27 19:23:04.970][trace][12633][149] <- CPB time=8117, okbps=4,0,0, ikbps=320,0,0
Encoder => Origin => Edge => Player,整个分发集群的日志都直接找到!O了,快速直接!
可倒追溯日志
可追溯日志,上一节所描述的,可以从播放器追溯到边缘服务器,从边缘追溯到上层,上层到上上层,一直到源站。
可倒追溯日志,指的是反过来从源站知道下层的回源ID,下层知道边缘的回源ID。边缘上自然有每个连接的日志。
譬如开启一个源站一个边缘,查询源站的日志,关键字是edge-srs:
[winlin@dev6 srs]$ grep -ina "edge-srs" objs/srs.origin.log
30:[2014-08-06 09:41:31.649][trace][21433][107] edge-srs ip=192.168.1.159, version=0.9.189, pid=21435, id=108
可以知道这个播放连接107是一个SRS回源链接,它在服务器192.168.1.159上面,进程是21435,回源链接id是108。在边缘服务器上查询这个连接的日志:
[winlin@dev6 srs]$ grep --color -ina "\[108\]" objs/srs.log
29:[2014-08-06 10:09:34.579][trace][22314][108] edge pull connected, can_publish=1, url=rtmp://dev:1935/live/livestream, server=127.0.0.1:1936
30:[2014-08-06 10:09:34.591][trace][22314][108] complex handshake success.
31:[2014-08-06 10:09:34.671][trace][22314][108] connected, version=0.9.190, ip=127.0.0.1, pid=22288, id=107
32:[2014-08-06 10:09:34.672][trace][22314][108] out chunk size to 60000
33:[2014-08-06 10:09:34.672][trace][22314][108] ignore the disabled transcode:
34:[2014-08-06 10:09:34.672][trace][22314][108] edge change from 100 to state 101 (pull).
35:[2014-08-06 10:09:34.672][trace][22314][108] input chunk size to 60000
36:[2014-08-06 10:09:34.672][trace][22314][108] got metadata, width=768, height=320, vcodec=7, acodec=10
37:[2014-08-06 10:09:34.672][trace][22314][108] 46B video sh, codec(7, profile=100, level=32, 0x0, 0kbps, 0fps, 0s)
38:[2014-08-06 10:09:34.672][trace][22314][108] 4B audio sh, codec(10, profile=1, 2channels, 0kbps, 44100HZ), flv(16bits, 2channels, 44100HZ)
39:[2014-08-06 10:09:34.779][trace][22314][107] update source_id=108[108]
46:[2014-08-06 10:09:36.853][trace][22314][110] source url=__defaultVhost__/live/livestream, ip=192.168.1.179, cache=1, is_edge=1, source_id=108[108]
50:[2014-08-06 10:09:44.949][trace][22314][108] <- EIG time=10293, okbps=3,0,0, ikbps=441,0,0
53:[2014-08-06 10:09:47.805][warn][22314][108][4] origin disconnected, retry. ret=1007
可以查询这个source下面的链接,关键字是source_id=108。以此类推,查回源链接的信息时,可以看到所有连接到该回源链接的客户端id(grep时先过滤进程号,然后过滤id):
39:[2014-08-06 10:09:34.779][trace][22314][107] update source_id=108[108]
46:[2014-08-06 10:09:36.853][trace][22314][110] source url=__defaultVhost__/live/livestream, ip=192.168.1.179, cache=1, is_edge=1, source_id=108[108]
可以看到有两个连接,一个是107,一个是110。连接107是播放后才回源,110是已经在回源了然后播放的。
可任意追溯
以为支持可追溯以及可倒追溯日志,所以我们在任意节点开始都可以找到整个分发链路。
开启一个边缘一个源站,源站ingest推流,两个客户端连接到边缘播放,边缘回源站取流。
假设我知道流名称,或者不知道流名称,反正任意信息,譬如我知道播放的链接会打一个"type=Play"的标记出来,就从这一点开始。假设从源站开始:
[winlin@dev6 srs]$ grep -ina "type=Play" objs/srs.origin.log
31:[2014-08-06 10:09:34.671][trace][22288][107] client identified, type=Play, stream_name=livestream, duration=-1.00
发现有个107的链接播放了源站信息,查看它的日志:
[winlin@dev6 srs]$ grep -ina "\[107\]" objs/srs.origin.log
27:[2014-08-06 10:09:34.589][trace][22288][107] RTMP client ip=127.0.0.1
28:[2014-08-06 10:09:34.591][trace][22288][107] complex handshake success
29:[2014-08-06 10:09:34.631][trace][22288][107] connect app, tcUrl=rtmp://dev:1935/live, pageUrl=http://www.ossrs.net/players/srs_player.html?vhost=dev&stream=livestream&server=dev&port=1935, swfUrl=http://www.ossrs.net/players/srs_player/release/srs_player.swf?_version=1.23, schema=rtmp, vhost=__defaultVhost__, port=1935, app=live, args=(obj)
30:[2014-08-06 10:09:34.631][trace][22288][107] edge-srs ip=192.168.1.159, version=0.9.190, pid=22314, id=108
31:[2014-08-06 10:09:34.671][trace][22288][107] client identified, type=Play, stream_name=livestream, duration=-1.00
32:[2014-08-06 10:09:34.671][trace][22288][107] out chunk size to 60000
33:[2014-08-06 10:09:34.671][trace][22288][107] source url=__defaultVhost__/live/livestream, ip=127.0.0.1, cache=1, is_edge=0, source_id=105[105]
34:[2014-08-06 10:09:34.672][trace][22288][107] dispatch cached gop success. count=307, duration=4515
35:[2014-08-06 10:09:34.672][trace][22288][107] create consumer, queue_size=30.00, tba=44100, tbv=25
36:[2014-08-06 10:09:34.672][trace][22288][107] ignored. set buffer length to 1000
37:[2014-08-06 10:09:34.673][trace][22288][107] input chunk size to 60000
40:[2014-08-06 10:09:44.748][trace][22288][107] -> PLA time=10007, msgs=0, okbps=464,0,0, ikbps=3,0,0
41:[2014-08-06 10:09:47.805][warn][22288][107][104] client disconnect peer. ret=1004
可以看到源id是105,关键字是source_id=105,查这个源:
[winlin@dev6 srs]$ grep --color -ina "\[105\]" objs/srs.origin.log
16:[2014-08-06 10:09:30.331][trace][22288][105] RTMP client ip=127.0.0.1
17:[2014-08-06 10:09:30.331][trace][22288][105] srand initialized the random.
18:[2014-08-06 10:09:30.332][trace][22288][105] simple handshake success.
19:[2014-08-06 10:09:30.373][trace][22288][105] connect app, tcUrl=rtmp://127.0.0.1:1936/live?vhost=__defaultVhost__, pageUrl=, swfUrl=, schema=rtmp, vhost=__defaultVhost__, port=1936, app=live, args=null
21:[2014-08-06 10:09:30.417][trace][22288][105] client identified, type=publish(FMLEPublish), stream_name=livestream, duration=-1.00
22:[2014-08-06 10:09:30.417][trace][22288][105] out chunk size to 60000
23:[2014-08-06 10:09:30.418][trace][22288][105] source url=__defaultVhost__/live/livestream, ip=127.0.0.1, cache=1, is_edge=0, source_id=-1[-1]
24:[2014-08-06 10:09:30.466][trace][22288][105] got metadata, width=768, height=320, vcodec=7, acodec=10
25:[2014-08-06 10:09:30.466][trace][22288][105] 46B video sh, codec(7, profile=100, level=32, 0x0, 0kbps, 0fps, 0s)
26:[2014-08-06 10:09:30.466][trace][22288][105] 4B audio sh, codec(10, profile=1, 2channels, 0kbps, 44100HZ), flv(16bits, 2channels, 44100HZ)
33:[2014-08-06 10:09:34.671][trace][22288][107] source url=__defaultVhost__/live/livestream, ip=127.0.0.1, cache=1, is_edge=0, source_id=105[105]
38:[2014-08-06 10:09:40.732][trace][22288][105] <- CPB time=10100, okbps=3,0,0, ikbps=332,0,0
可见这个就是ingest的连接,即编码器推流连接。已经查到了源头。
同时可以看到107这个其实是srs的回源链接,关键字是edge-srs:
30:[2014-08-06 10:09:34.631][trace][22288][107] edge-srs ip=192.168.1.159, version=0.9.190, pid=22314, id=108
可以去边缘服务器上查它的信息,id是108:
[winlin@dev6 srs]$ grep --color -ina "\[108\]" objs/srs.log
29:[2014-08-06 10:09:34.579][trace][22314][108] edge pull connected, can_publish=1, url=rtmp://dev:1935/live/livestream, server=127.0.0.1:1936
30:[2014-08-06 10:09:34.591][trace][22314][108] complex handshake success.
31:[2014-08-06 10:09:34.671][trace][22314][108] connected, version=0.9.190, ip=127.0.0.1, pid=22288, id=107
32:[2014-08-06 10:09:34.672][trace][22314][108] out chunk size to 60000
33:[2014-08-06 10:09:34.672][trace][22314][108] ignore the disabled transcode:
34:[2014-08-06 10:09:34.672][trace][22314][108] edge change from 100 to state 101 (pull).
35:[2014-08-06 10:09:34.672][trace][22314][108] input chunk size to 60000
36:[2014-08-06 10:09:34.672][trace][22314][108] got metadata, width=768, height=320, vcodec=7, acodec=10
37:[2014-08-06 10:09:34.672][trace][22314][108] 46B video sh, codec(7, profile=100, level=32, 0x0, 0kbps, 0fps, 0s)
38:[2014-08-06 10:09:34.672][trace][22314][108] 4B audio sh, codec(10, profile=1, 2channels, 0kbps, 44100HZ), flv(16bits, 2channels, 44100HZ)
39:[2014-08-06 10:09:34.779][trace][22314][107] update source_id=108[108]
46:[2014-08-06 10:09:36.853][trace][22314][110] source url=__defaultVhost__/live/livestream, ip=192.168.1.179, cache=1, is_edge=1, source_id=108[108]
50:[2014-08-06 10:09:44.949][trace][22314][108] <- EIG time=10293, okbps=3,0,0, ikbps=441,0,0
53:[2014-08-06 10:09:47.805][warn][22314][108][4] origin disconnected, retry. ret=1007
这个边缘服务器上这个回源链接有两个客户端连接上,107和110,关键字是source_id=108:
[winlin@dev6 srs]$ grep --color -ina "\[107\]" objs/srs.log
18:[2014-08-06 10:09:34.281][trace][22314][107] RTMP client ip=192.168.1.179
19:[2014-08-06 10:09:34.282][trace][22314][107] srand initialized the random.
20:[2014-08-06 10:09:34.291][trace][22314][107] complex handshake success
21:[2014-08-06 10:09:34.291][trace][22314][107] connect app, tcUrl=rtmp://dev:1935/live, pageUrl=http://www.ossrs.net/players/srs_player.html?vhost=dev&stream=livestream&server=dev&port=1935, swfUrl=http://www.ossrs.net/players/srs_player/release/srs_player.swf?_version=1.23, schema=rtmp, vhost=__defaultVhost__, port=1935, app=live, args=null
22:[2014-08-06 10:09:34.532][trace][22314][107] ignored. set buffer length to 800
23:[2014-08-06 10:09:34.568][trace][22314][107] client identified, type=Play, stream_name=livestream, duration=-1.00
24:[2014-08-06 10:09:34.568][trace][22314][107] out chunk size to 60000
25:[2014-08-06 10:09:34.568][trace][22314][107] source url=__defaultVhost__/live/livestream, ip=192.168.1.179, cache=1, is_edge=1, source_id=-1[-1]
26:[2014-08-06 10:09:34.579][trace][22314][107] dispatch cached gop success. count=0, duration=0
27:[2014-08-06 10:09:34.579][trace][22314][107] create consumer, queue_size=30.00, tba=0, tbv=0
28:[2014-08-06 10:09:34.579][trace][22314][107] ignored. set buffer length to 800
39:[2014-08-06 10:09:34.779][trace][22314][107] update source_id=108[108]
54:[2014-08-06 10:09:47.805][trace][22314][107] cleanup when unpublish
55:[2014-08-06 10:09:47.805][trace][22314][107] edge change from 101 to state 0 (init).
56:[2014-08-06 10:09:47.805][warn][22314][107][9] client disconnect peer. ret=1004
107是触发回源的连接。查看110这个链接:
[winlin@dev6 srs]$ grep --color -ina "\[110\]" objs/srs.log
40:[2014-08-06 10:09:36.609][trace][22314][110] RTMP client ip=192.168.1.179
41:[2014-08-06 10:09:36.613][trace][22314][110] complex handshake success
42:[2014-08-06 10:09:36.613][trace][22314][110] connect app, tcUrl=rtmp://dev:1935/live, pageUrl=http://www.ossrs.net/players/srs_player.html?vhost=dev&stream=livestream&server=dev&port=1935, swfUrl=http://www.ossrs.net/players/srs_player/release/srs_player.swf?_version=1.23, schema=rtmp, vhost=__defaultVhost__, port=1935, app=live, args=null
43:[2014-08-06 10:09:36.835][trace][22314][110] ignored. set buffer length to 800
44:[2014-08-06 10:09:36.853][trace][22314][110] client identified, type=Play, stream_name=livestream, duration=-1.00
45:[2014-08-06 10:09:36.853][trace][22314][110] out chunk size to 60000
46:[2014-08-06 10:09:36.853][trace][22314][110] source url=__defaultVhost__/live/livestream, ip=192.168.1.179, cache=1, is_edge=1, source_id=108[108]
47:[2014-08-06 10:09:36.853][trace][22314][110] dispatch cached gop success. count=95, duration=1573
48:[2014-08-06 10:09:36.853][trace][22314][110] create consumer, queue_size=30.00, tba=44100, tbv=25
49:[2014-08-06 10:09:36.853][trace][22314][110] ignored. set buffer length to 800
51:[2014-08-06 10:09:45.919][trace][22314][110] -> PLA time=8759, msgs=21, okbps=461,0,0, ikbps=3,0,0
52:[2014-08-06 10:09:46.247][warn][22314][110][104] client disconnect peer. ret=1004
可见110也是个flash播放连接。
系统信息
日志中有版本和配置信息,以及使用的pid文件,侦听的端口,启动前几条日志就是:
[winlin@dev6 srs]$ ./objs/srs -c console.conf
[winlin@dev6 srs]$ cat objs/srs.log
[2014-04-04 11:39:24.176][trace][0][0] config parsed EOF
[2014-04-04 11:39:24.176][trace][0][0] log file is ./objs/srs.log
[2014-04-04 11:39:24.177][trace][0][0] srs 0.9.46
[2014-04-04 11:39:24.177][trace][0][0] uname: Linux dev6 2.6.32-71.el6.x86_64
#1 SMP Fri May 20 03:51:51 BST 2011 x86_64 x86_64 x86_64 GNU/Linux
[2014-04-04 11:39:24.177][trace][0][0] build: 2014-04-03 18:38:23, little-endian
[2014-04-04 11:39:24.177][trace][0][0] configure:  --dev --with-hls --with-nginx
--with-ssl --with-ffmpeg --with-http-callback --with-http-server --with-http-api
--with-librtmp --with-bwtc --with-research --with-utest --without-gperf --without-gmc
--without-gmp --without-gcp --without-gprof --without-arm-ubuntu12 --jobs=1
--prefix=/usr/local/srs
[2014-04-04 11:39:24.177][trace][0][0] write pid=4021 to ./objs/srs.pid success!
[2014-04-04 11:39:24.177][trace][100][16] server started, listen at port=1935, type=0, fd=6
[2014-04-04 11:39:24.177][trace][100][16] server started, listen at port=1985, type=1, fd=7
[2014-04-04 11:39:24.177][trace][100][16] server started, listen at port=8080, type=2, fd=8
[2014-04-04 11:39:24.177][trace][101][16] listen cycle start, port=1935, type=0, fd=6
[2014-04-04 11:39:24.177][trace][102][11] listen cycle start, port=1985, type=1, fd=7
[2014-04-04 11:39:24.177][trace][103][11] listen cycle start, port=8080, type=2, fd=8
[2014-04-04 11:39:26.799][trace][0][11] get a signal, signo=2
[2014-04-04 11:39:26.799][trace][0][11] user terminate program
主要信息包括:
- 日志文件:[2014-04-04 11:39:24.176][trace][0][0] log file is ./objs/srs.log
- 系统版本:[2014-04-04 11:39:24.177][trace][0][0] srs 0.9.46
- 编译系统信息:[2014-04-04 11:39:24.177][trace][0][0] uname: Linux dev6 2.6.32-71.el6.x86_64 #1 SMP Fri May 20 03:51:51 BST 2011 x86_64 x86_64 x86_64 GNU/Linux
- 编译日期:[2014-04-04 11:39:24.177][trace][0][0] build: 2014-04-03 18:38:23, little-endian
- 编译参数:[2014-04-04 11:39:24.177][trace][0][0] configure: --dev --with-hls --with-nginx --with-ssl --with-ffmpeg --with-http-callback --with-http-server --with-http-api --with-librtmp --with-bwtc --with-research --with-utest --without-gperf --without-gmc --without-gmp --without-gcp --without-gprof --without-arm-ubuntu12 --jobs=1 --prefix=/usr/local/srs
- PID文件:[2014-04-04 11:39:24.177][trace][0][0] write pid=4021 to ./objs/srs.pid success!
- 侦听端口1935(RTMP):[2014-04-04 11:39:24.177][trace][100][16] server started, listen at port=1935, type=0, fd=6
- 侦听1985(HTTP接口):[2014-04-04 11:39:24.177][trace][100][16] server started, listen at port=1985, type=1, fd=7
- 侦听8080(HTTP服务):[2014-04-04 11:39:24.177][trace][100][16] server started, listen at port=8080, type=2, fd=8
- 侦听循环开始,准备接受连接:[2014-04-04 11:39:24.177][trace][101][16] listen cycle start, port=1935, type=0, fd=6
基于连接的日志
提供基于连接(会话, Sesssion, SrsId)的日志,对于排错至关重要。当然对于系统分析需要支持良好的api。
举例来说,服务器运行了1年,支持了1千万次访问。要知道这1千万个用户多少个用户点了暂停按钮,多少概率会跳过片头,多少用户观看了10分钟以上,都访问了些什么节目,这个属于大数据分析,需要集群提供api查询,集群能提供这个数据的前提是服务器能提供api查询。
用户投诉卡,或者观看不了,推流不成功,或者通过数据分析发现某个流的用户观看延迟很大。这种具体的问题,就需要分析某个连接的日志。
假设需要知道推流的编码器的日志,流是rtmp://192.168.1.107:1935/live/livestream,那么先需要观察日志,一般推流的日志如下:
[2014-04-04 11:56:06.074][trace][104][11] rtmp get peer ip success. ip=192.168.1.179,
send_to=30000000us, recv_to=30000000us
[2014-04-04 11:56:06.080][trace][104][11] srand initialized the random.
[2014-04-04 11:56:06.082][trace][104][11] simple handshake with client success.
[2014-04-04 11:56:06.083][trace][104][11] rtmp connect app success.
tcUrl=rtmp://192.168.1.107:1935/live, pageUrl=, swfUrl=rtmp://192.168.1.107:1935/live,
schema=rtmp, vhost=__defaultVhost__, port=1935, app=live
[2014-04-04 11:56:06.288][trace][104][11] set ack window size to 2500000
[2014-04-04 11:56:06.288][trace][104][11] identify ignore messages except AMF0/AMF3
command message. type=0x5
[2014-04-04 11:56:06.288][trace][104][11] identify client success.
type=publish(FMLEPublish), stream_name=livestream
查找标识id:
- 可以grep关键字
identify client success,然后grep关键字type=publish,然后grep关键字livestream。 - 如果熟悉的话,也可以直接grep关键字
identify client success. type=publish,然后grep关键字livestream。 - 也可以分步实现,先grep关键字
identify client success. type=publish,把所有推流的连接找出来。然后观察后再加条件。
结果如下:
[winlin@dev6 srs]$ cat objs/srs.log|grep -ina "identify client success. type=publish"
20:[2014-04-04 11:56:06.288][trace][104][11] identify client success. type=publish, stream_name=livestream
43:[2014-04-04 11:56:18.138][trace][105][11] identify client success. type=publish, stream_name=winlin
65:[2014-04-04 11:56:29.531][trace][106][11] identify client success. type=publish, stream_name=livestream
86:[2014-04-04 11:56:35.966][trace][107][11] identify client success. type=publish, stream_name=livestream
可见有几次推流,还有其他的流。可是根据时间过滤,或者根据流名称:
[winlin@dev6 srs]$ cat objs/srs.log|grep -ina "identify client success. type=publish"|grep -a "livestream"
20:[2014-04-04 11:56:06.288][trace][104][11] identify client success. type=publish, stream_name=livestream
65:[2014-04-04 11:56:29.531][trace][106][11] identify client success. type=publish, stream_name=livestream
86:[2014-04-04 11:56:35.966][trace][107][11] identify client success. type=publish, stream_name=livestream
找到了三个推流连接,还可以继续筛选。假设我们看第一个,那么标识是104,可以grep关键字\[104\]\[,譬如:
[winlin@dev6 srs]$ cat objs/srs.log |grep -ina "\[104\]\["
14:[2014-04-04 11:56:06.074][trace][104][11] rtmp get peer ip success. ip=192.168.1.179,
send_to=30000000us, recv_to=30000000us
15:[2014-04-04 11:56:06.080][trace][104][11] srand initialized the random.
16:[2014-04-04 11:56:06.082][trace][104][11] simple handshake with client success.
17:[2014-04-04 11:56:06.083][trace][104][11] rtmp connect app success.
tcUrl=rtmp://192.168.1.107:1935/live, pageUrl=, swfUrl=rtmp://192.168.1.107:1935/live,
schema=rtmp, vhost=__defaultVhost__, port=1935, app=live
18:[2014-04-04 11:56:06.288][trace][104][11] set ack window size to 2500000
19:[2014-04-04 11:56:06.288][trace][104][11] identify ignore messages except AMF0/AMF3
command message. type=0x5
20:[2014-04-04 11:56:06.288][trace][104][11] identify client success.
type=publish(FMLEPublish), stream_name=livestream
21:[2014-04-04 11:56:06.288][trace][104][11] set output chunk size to 60000
22:[2014-04-04 11:56:06.288][trace][104][11] set chunk_size=60000 success
23:[2014-04-04 11:56:07.397][trace][104][11] <- time=225273, obytes=4168, ibytes=7607, okbps=32, ikbps=59
24:[2014-04-04 11:56:07.398][trace][104][11] dispatch metadata success.
25:[2014-04-04 11:56:07.398][trace][104][11] process onMetaData message success.
26:[2014-04-04 11:56:07.398][trace][104][11] update video sequence header success. size=67
27:[2014-04-04 11:56:08.704][trace][104][11] <- time=226471, obytes=4168, ibytes=36842, okbps=13, ikbps=116
28:[2014-04-04 11:56:09.901][trace][104][11] <- time=227671, obytes=4168, ibytes=67166, okbps=9, ikbps=152
29:[2014-04-04 11:56:11.102][trace][104][11] <- time=228869, obytes=4168, ibytes=97481, okbps=6, ikbps=155
30:[2014-04-04 11:56:11.219][trace][104][11] clear cache/metadata/sequence-headers when unpublish.
31:[2014-04-04 11:56:11.219][trace][104][11] control message(unpublish) accept, retry stream service.
32:[2014-04-04 11:56:11.219][trace][104][11] ignore AMF0/AMF3 command message.
33:[2014-04-04 11:56:11.419][trace][104][11] drop the AMF0/AMF3 command message, command_name=deleteStream
34:[2014-04-04 11:56:11.420][trace][104][11] ignore AMF0/AMF3 command message.
35:[2014-04-04 11:56:12.620][error][104][104] recv client message failed. ret=207(Connection reset by peer)
36:[2014-04-04 11:56:12.620][error][104][104] identify client failed. ret=207(Connection reset by peer)
37:[2014-04-04 11:56:12.620][warn][104][104] client disconnect peer. ret=204
[winlin@dev6 srs]$
这个连接的日志就都出来了,重点关注warn和error日志。可以看到这个是客户端关闭了连接:36:[2014-04-04 11:56:12.620][error][104][104] identify client failed. ret=207(Connection reset by peer)。
守护进程
为何默认启动srs时只有一条日志呢?原因是守护进程方式启动时,日志会打印到文件。
一个相关的配置是守护进程方式启动,这样就不要nohup启动了(实际上是程序实现了nohup):
# whether start as deamon
# default: on
daemon              on;
若希望不以daemon启动,且日志打印到console,可以使用配置conf/console.conf:
# no-daemon and write log to console config for srs.
# @see full.conf for detail config.

listen              1935;
daemon              off;
srs_log_tank        console;
vhost __defaultVhost__ {
}
启动方式:
./objs/srs -c conf/console.conf
系统默认方式是daemon+log2file,具体参考full.conf的说明。
注意:init.d脚本启动会将console日志也打印到文件,若没有指定文件,默认文件为./objs/srs.log。脚本启动尽量保证日志不丢失。
注意:一般以daemon后台启动,并将日志写到文件(默认),srs会提示配置解析成功,日志写到文件。
[winlin@dev6 srs]$ ./objs/srs -c conf/srs.conf
[2014-04-14 12:12:57.775][trace][0][0] config parse complete
[2014-04-14 12:12:57.775][trace][0][0] write log to file ./objs/srs.log
[2014-04-14 12:12:57.775][trace][0][0] you can: tailf ./objs/srs.log
[2014-04-14 12:12:57.775][trace][0][0] @see: https://github.com/ossrs/srs/wiki/v3_CN_SrsLog
Winlin 2014.3